
GEO KPIs: The Metrics to Report to Your Board

Othmane Khadri · Founder, Earleads

Summary
GEO KPIs are the numbers that show whether AI answers name your brand and whether that turns into revenue. A board needs six of them, not twenty: share of answers on unbranded questions, accuracy, what each piece of work earned, branded search lift, pipeline, and cost per citation against customer value. Report commitments and targets separately, and label every number measured or correlated.
On this page
- What are GEO KPIs?
- Why most GEO dashboards fail in the boardroom
- Commitments vs targets: the split that keeps a report honest
- Measured vs correlated: label every number
- The six GEO KPIs a board should see
- Step 1: Fix the question list before you measure anything
- Step 2: Measure share of answers, not rank
- Step 3: Report accuracy, not only appearance
- Step 4: Show what each piece of work earned
- Step 5: Read branded search and signup answers against the work
- Step 6: Join it to pipeline and set the day 90 test
- A sample one-page GEO board view
- What to judge in month 1, 2 and 3
- GEO KPIs for B2B vs B2C
- Metrics to keep off the board slide
What are GEO KPIs?
GEO KPIs are the numbers that tell you whether generative engine optimization is working. They measure how often ChatGPT, Perplexity, Gemini, Claude and Google’s AI features name or cite your brand when buyers ask about your category, how accurately they describe you, and whether any of that reaches branded search, signups, pipeline and revenue.
Most lists of GEO metrics run to 12 or 15 items. That’s fine for the person running the work. It’s useless for a board. Leadership needs a handful of numbers that answer two questions. Are we in the answers buyers read? And is it worth what we spend?
This guide covers the six GEO KPIs we’d put in front of a board, how to measure each one, and the two rules that keep a GEO report honest (commitments apart from targets, measured apart from correlated). It ends with a sample one-page board view you can copy. A word on who’s writing. Earleads runs AI search visibility programmes for B2B and B2C brands, and this is the reporting model we use with clients after the audit. None of it depends on hiring anyone.
If you need the tracking setup underneath (GA4 channel groups, HubSpot AI Referrals, the signup question), our guide to AI search analytics covers it step by step. This article is the layer above it, deciding which of those numbers a board should see and how to frame them.
Why most GEO dashboards fail in the boardroom
GEO dashboards usually fail for one of three reasons, and none of them is a lack of data.
They count what’s easy, not what compounds. Views, mentions and posts published are simple to count and they go up every month. But reach isn’t what gets a brand cited. In the programmes we run, high-reach threads often earn no citations while small threads built around a literal buyer question earn them. An agency that reports reach is reporting the part of the work that doesn’t compound.
They use referral traffic as the scoreboard. AI sends citations, not clicks. Conductor’s 2026 benchmarks, built on 13,770 domains, found AI referral traffic “accounts for 1.08% of all website traffic” (Conductor). Google says clicks from AI Overviews and AI Mode are “included in the overall search traffic in Search Console,” inside the Web search type (Google Search Central), so they don’t show up as AI at all. Judge GEO by referrals and you’ll cancel the channel buyers use to build their shortlists.
They report a rank that doesn’t exist. SparkToro had 600 volunteers run 12 prompts through ChatGPT, Claude and Google’s AI 2,961 times. They found a “<1 in 100 chance” that two answers would give the same list of brands, and concluded that “any tool that gives a ‘ranking position in AI’ is full of baloney” (SparkToro, January 2026). The same study found that visibility percentage across many prompts run many times “is a reasonable metric.” That’s the basis for the first KPI below.
There’s a fourth failure that’s more human. Leadership checks for themselves. A CEO types the category’s top question into ChatGPT in the middle of a meeting, sees no mention of the company, and the dashboard that looked great loses all credibility. Your report should predict what they’ll see when they check, not argue with it.
Commitments vs targets: the split that keeps a report honest
The first rule is to keep two kinds of numbers apart.
Commitments are volumes the team controls. Pages published or refreshed, comparison pages shipped, community threads posted, site fixes released, directory listings corrected. If a commitment is missed, someone didn’t do the work, and the report should say who and why.
Targets are what engines and buyers do in response. Share of answers, citations, how the brand is described, branded search, pipeline. Nobody controls these directly, so nobody honest guarantees them. Anyone who promises that ChatGPT will recommend you is promising something no agency or in-house team controls.
Report both every month, including the months they disappoint. A missed commitment and a missed target are different conversations. The first is an execution problem. The second might mean the work needs more time, the questions are wrong, or the category is too small to be worth it. Merge them into one “GEO score” and the board can’t tell which conversation to have.
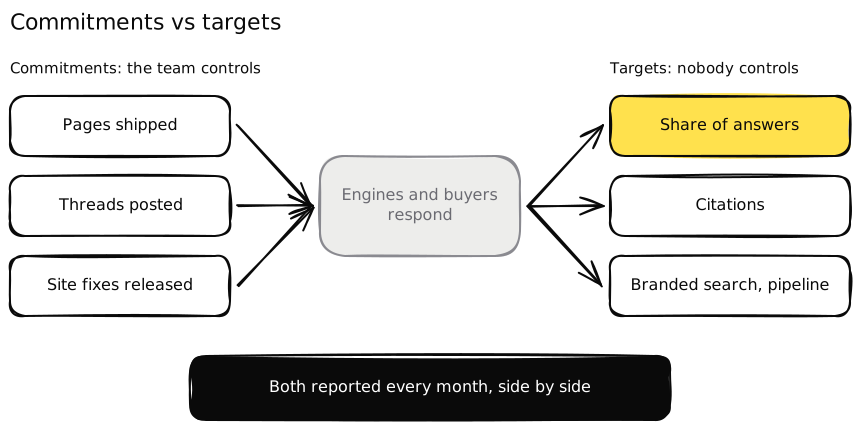 Commitments are the work. Targets are the response. A board report shows both, side by side, every month.
The same split belongs in any agency contract. Our guides on how to choose a GEO agency and GEO pricing go into what that looks like in a quote.
Measured vs correlated: label every number
The second rule is about honesty in attribution. Some GEO metrics are measured directly. Others are correlated, meaning they moved around the same time as the work and you have reasons to believe the work caused it.
- Measured. Share of answers on your question set. What each engine says about you. Which of your pages and threads are cited. AI referral sessions. Signups or deals with an AI source on the record.
- Correlated. Branded search lift in the weeks after citations landed. Direct traffic lift over the same weeks. Pipeline growth in periods when GEO was the main new activity.
Both belong in a board report. They never belong merged into one flattering number. “AI referrals sent 40 sessions” is measured. “Branded search rose after these citations landed” is correlated. Add them together into “AI influenced pipeline” and the first person who pulls the number apart will stop trusting the whole report.
A simple fix is to put an M or a C next to every number on the board view. It costs nothing, and it shows leadership you know the difference.
The six GEO KPIs a board should see
These are the six we’d keep. Everything else is a working metric for the team.
| GEO KPI | Question it answers | Measured or correlated | Commitment or target |
|---|---|---|---|
| Share of answers on unbranded questions | Are we in the answers buyers read? | Measured | Target |
| Accuracy of how AI describes us | When we appear, is it right? | Measured | Target |
| What each piece of work earned | Is the work being cited? | Measured | Commitment plus target |
| Branded search lift | Are more people looking for us by name? | Correlated | Target |
| Pipeline or sales against what was published | Is it reaching revenue? | Measured and correlated, shown apart | Target |
| Cost per citation vs customer value | Is it worth the money? | Measured inputs, judged at day 90 | Target |
The steps below explain how to measure each one so it holds up when someone on the board asks how it was calculated.
Step 1: Fix the question list before you measure anything
Every GEO KPI depends on which questions you measure, so the list comes first and it gets signed off before any answer is recorded. Otherwise someone (an agency, a tool or your own team) will pick questions the brand already wins and the dashboard will look healthy from day one.
What a good list looks like:
- Built from sales language, not a keyword tool. The questions buyers ask on calls, in demos and in lost deal notes. For B2B that’s shortlist and comparison questions. For B2C it’s “best X for Y” and “is X worth it”.
- Mostly unbranded. Questions that don’t name you are the ones that create new demand. Keep a small set of validation questions too (“is X legit?”, “X reviews”), because those measure trust, not findability.
- Kept only if an answer exists. Run each question live. If engines don’t answer it, drop it.
- Signed off by sales and leadership. The board should know which questions the KPI covers, and that the list didn’t change to make a month look better.
Our guide to what an AI visibility audit should show you covers building and approving the list in more detail.
Step 2: Measure share of answers, not rank
Share of answers (often called AI share of voice) is the headline GEO KPI. It’s the share of AI answers on your question set that name your brand, next to the same share for named competitors.
How to make it board grade:
- Report it per engine. ChatGPT, Perplexity, Gemini, Claude and Google’s AI features often disagree. An average hides the engine where you’re missing.
- Compare against three named competitors. “We appear in a third of answers” means little alone. “We appear in a third, the leader appears in half” is a decision.
- Sample, don’t snapshot. Run priority questions many times per engine and report an appearance rate. Given the SparkToro finding above, a single run is closer to an anecdote than a measurement. Our enterprise GEO strategy guide explains how we sample.
- Run natively where possible. Many tools query engines through an API, which isn’t always what a buyer sees in the app. Check your tool against a logged-out run in each engine once a month. When they disagree, trust the live run.
- Never report an average rank. Report how often you appear, and where you sit when you do appear as a secondary reading.
Keep the definition stable. Some tools calculate share of voice in ways that can add up to more than 100% across brands, and vendors sometimes change methods between quarters. Write your formula on the report and keep it fixed, so month seven is comparable with month one.
Step 3: Report accuracy, not only appearance
Appearing isn’t enough if the answer is wrong. An engine that names you but quotes a pricing tier you dropped last year, or describes you as a beginner product when you sell to enterprises, is costing you deals. The most dangerous wrong answer is the one a prospect repeats to sales on a live call.
For the board, keep this to one line. How many factual claims the engines make about you (pricing, product, positioning, leadership) are wrong or stale this month, and which are being fixed. Ask sales to log any AI claim a prospect repeats, so the number reflects what buyers actually hear. Our guide to AI reputation management covers tracing a wrong answer to its source and correcting it.
Step 4: Show what each piece of work earned
This is where commitments and targets meet. Keep a dated log of every page, refresh, comparison page and community thread, with the day it went live and the buyer question it targets. Then, for each row, record what it earned. Was it cited, by which engines, and did any referral visits or deals touch it?
Two reasons this belongs on the board view, even as a short summary:
- It proves cause better than any chart. “Share of answers rose” is a target. “These five pages and threads are now cited on the questions we track” ties the target to the work.
- It shows where to spend next. If comparison pages earn citations and blog posts don’t, the next quarter’s commitments should change.
Mentions matter more than links here. Ahrefs found branded web mentions correlate with AI Overview brand visibility at 0.664, against 0.218 for backlinks, across 75,000 brands (Ahrefs). So a row that earned a mention on a page engines already cite can be worth more than a row that earned a link. Our article on how to get cited by AI covers which work tends to earn citations.
Step 5: Read branded search and signup answers against the work
Because AI sends citations rather than clicks, the effect often shows up somewhere else. A buyer reads an answer, then searches your name or types your domain days later. Two numbers catch most of that.
Branded search lift. In Search Console, track impressions and clicks for queries containing your brand, week by week. Read the lift against the weeks your citations landed, using the action log from Step 4. A lift in a week with a product launch proves nothing. A lift that follows two or three separate clusters of citations, with nothing else running, is a pattern you can defend. Mark it C, for correlated.
What buyers say. A free text “how did you hear about us” field at signup, demo request or checkout is the only way to catch the visitor ChatGPT told about you who then typed your URL. Count the answers that mention an assistant each month. It’s a small number, and it’s measured.
Step 6: Join it to pipeline and set the day 90 test
Leadership funds revenue, so one line on the board view has to reach it. Show trials, demos, pipeline or sales next to what was published, keeping the measured part (deals with an AI source on the CRM record, signup answers) apart from the correlated part (pipeline growth in weeks citations landed).
Then set one test for day 90. What does a citation cost, compared with what a customer is worth? Divide what you spent on the programme by the citations it earned on your tracked questions, and set it next to the value of a customer. If a citation costs more than a customer is worth, the honest answer is to say so and change the plan or stop. This is the number that turns GEO from a visibility project into an investment decision.
A sample one-page GEO board view
Here’s what the page can look like. Every figure below is invented for a fictional software company and is only there to show the format. They are not benchmarks and not results from any client.
Fictional company, month 4. M = measured, C = correlated.
| Block | This month | Last month | Note |
|---|---|---|---|
| Share of answers, unbranded questions, ChatGPT (M) | 22% | 17% | Leader at 41%, competitor B at 19% |
| Share of answers, Perplexity (M) | 31% | 30% | Flat, cited mainly from two comparison pages |
| Share of answers, Google AI features (M) | 9% | 8% | Weakest engine, focus next month |
| Wrong or stale claims found (M) | 3 | 5 | Old pricing tier still quoted by one engine |
| Commitments: pages and threads shipped vs plan (M) | 14 of 16 | 12 of 12 | Two pages waiting on legal review |
| Work cited this month (M) | 6 items | 3 items | All six answer comparison questions |
| Branded search impressions (C) | +12% | +4% | Lift follows citations from weeks 2 and 3 |
| Signups naming an AI assistant (M) | 9 | 5 | Free text field, tagged weekly |
| Pipeline with AI source on record (M) | 4 deals | 2 deals | Separate from total pipeline growth (C) |
| Day 90 test | Due next month | Cost per citation vs customer value |
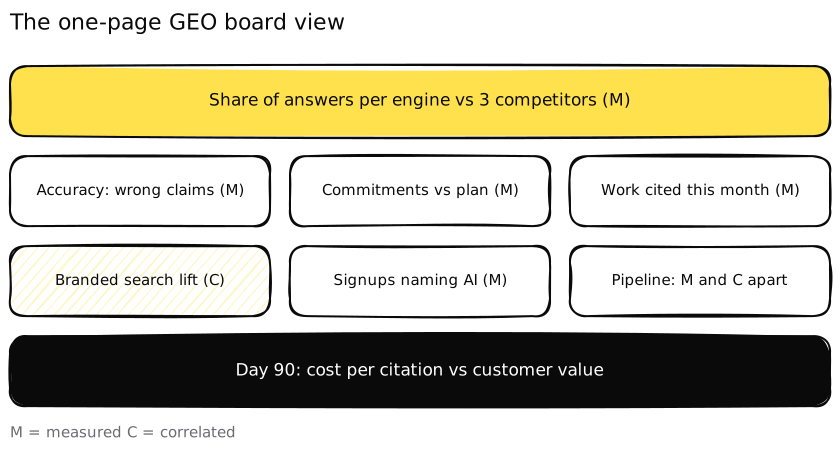 One page, read in two minutes. Every number carries an M or a C.
Three things make this page work. The commitments row shows a miss and explains it. The correlated rows are labelled, and pipeline is split. And the weakest engine is named, which tells leadership where next month’s effort goes. A quiet month looks like a quiet month, which is exactly what makes the good months believable.
What to judge in month 1, 2 and 3
GEO KPIs don’t all move at once, and judging the wrong one too early is how programmes get cancelled at week six. In our experience the order is community reach first, then citations of the new pages and threads, then the brand being named in answers, then Google rankings.
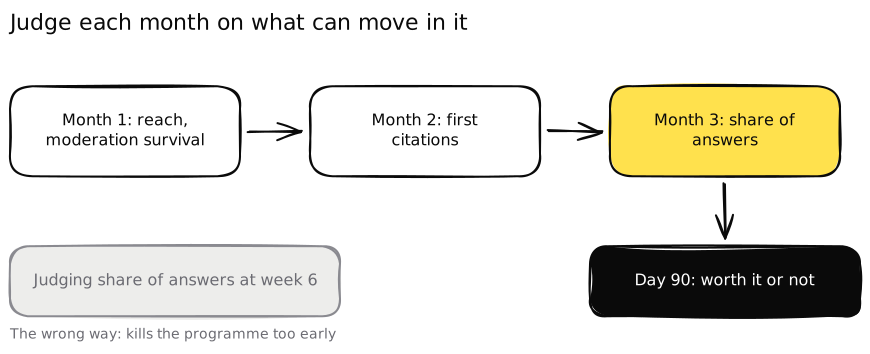 Judge each month on the KPI that can move in it.
- Month 1. Judge commitments, reach, and whether community posts survive moderation. Site readiness can also move within weeks if a rendering or crawler fix ships.
- Month 2. Judge first citations of the work. Community threads tend to earn more citations in their second month than their first.
- Month 3. Judge share of answers on the question set, and run the day 90 test.
Citations churn, too. An answer that cites you this week may not next week. So the useful board question isn’t “did we get cited?” but “is it holding?”, which is another reason to report appearance rates over repeated runs.
GEO KPIs for B2B vs B2C
The six KPIs stay the same. What changes is the question list and the revenue line.
B2B. Questions are shortlist and comparison questions (“best X for mid-market teams”, “X vs Y for agencies”), and named comparisons are usually won on your own site. Buying cycles are long, so pipeline with an AI source on the CRM record matters more than closed revenue in the first quarter. Accuracy weighs heavily, because one stale pricing claim can surface in a procurement call.
B2C. Questions are “best X for Y”, “is X worth it” and first-person experience questions, which engines often answer from community threads and reviews. Revenue is daily units and promo code redemptions against the action log. Validation questions (“is X legit?”) deserve their own line, because trust problems hit conversion fast.
Metrics to keep off the board slide
Some GEO metrics are useful for the team and misleading in front of leadership.
- Total mentions or views. Easy to grow, weakly tied to citations.
- Average AI rank. As SparkToro showed, a rank position across shifting answers doesn’t hold still long enough to mean much.
- AI referral traffic as the headline. Keep it as a measured floor in the pipeline block, never as the scoreboard.
- Vendor visibility scores you can’t explain. If you can’t write the formula on the slide, don’t put the number on it.
- Questions that name your brand. You’ll win them. That’s not the point.
Tools are good at counting and bad at deciding which counts matter. Use the cheapest one that covers your engines, keep the question list owned by sales, and keep the board page short enough that a CEO who checks ChatGPT for themselves sees what the report told them they’d see.
Get a personalised case study
Pick your industry and we'll email you the case closest to your business, numbers included.
Frequently asked questions
What are GEO KPIs?
GEO KPIs are the metrics used to judge generative engine optimization. They measure how often AI assistants such as ChatGPT, Perplexity, Gemini, Claude and Google's AI features name or cite your brand on the questions buyers ask, how accurately they describe you, and whether that visibility shows up in branded search, signups, pipeline and revenue.
How do you measure GEO?
Fix a list of buyer questions that sales has signed off, mostly ones that don't name your brand. Run each one natively in every engine you care about, many times for the priority questions, and record whether you appear, where, and how you're described. Then join those results to Search Console, your analytics or CRM, and a dated log of what you published.
What is AI share of voice?
AI share of voice is the share of AI answers on a fixed question set that name your brand, compared with the same share for named competitors. Report it per engine and as an appearance rate across repeated runs, never as a rank position, because AI answers change from one run to the next and a single run proves very little.
Should AI referral traffic be a GEO KPI?
Keep it on the report as a floor, not as the headline. Conductor's 2026 benchmarks put AI referral traffic at 1.08% of website traffic, and clicks from Google's AI features are counted inside normal search traffic. If referrals are the scoreboard, a channel that is shaping shortlists will look like it does nothing.
How often should GEO KPIs be reported to leadership?
Monthly for the board view, with the underlying questions re-measured about twice a month so each monthly number rests on more than one reading. A weekly operating view of what shipped, what is queued and what waits on someone is useful for the team, but it doesn't belong on the board slide.
How long before GEO KPIs move?
They move in an order. Community reach can move in the first month, citations of new pages and threads tend to compound in months two and three, and share of answers is the fair thing to judge from month three. Judging the whole programme on share of answers at week six usually kills it before the work has had time to land.